“Where do we go from here?”
- Chicago
The stock market has been extremely volatile this year, and we have all faced many challenges and obstacles. The COVID pandemic has changed the way we live and work, and it is likely that much of the change will stay with us. The stock market has had a “V” shaped recovery. The manufacturing side of the economy has also had a “V” shaped recovery, but several of the services sectors look more like a “swoosh”. Where do we go from here? Do we continue with the “V”? Or will services and manufacturing split to become a “K”? Or will growth rates slow so that it looks like a “square root”? As we continually reevaluate our portfolios, we have made some shifts in thinking (slowly transitioning from tech to other cyclicals) while reaffirming our confidence in several long-term trends. Overall, we are optimistic that society’s ability to adapt to a “new normal” and move forward with intelligent return to work policies, combined with human ingenuity on pharmaceutical treatments and vaccines will eventually lead to a resolution of this crisis. While we have reduced our cash position slightly over the past quarter, we are still keeping cash levels higher than normal in the near-term, as we work through election uncertainty and concerns of rising COVID cases heading into Fall/Winter.
Parts of the Economy Are Improving Swiftly “V”
Parts of the Economy Are Improving Slowly “Swoosh”
In the depths of the crisis, and after the CARES stimulus was passed, many economists were speculating on the shape of a recovery. What letter of the alphabet would the recovery resemble - U, L, V, W, swoosh or square root? So far, for the manufacturing sectors it looks like a “V”. For several services sectors it looks more like a “swoosh”.
Graph 1
Manufacturing is a “V”
PCE: Durable Goods, (SAAR, millions 2012 $)
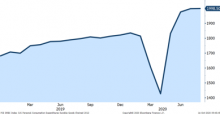
Source: Bloomberg
Graph 2
Services is a Swoosh
Change in card spending for lodging, restaurants, and amusement SA, (% difference from baseline)
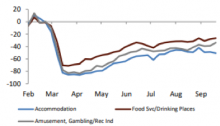
Source: Renmac
Where Do We Go from Here?
But where do we go from here? Do we stay on the “V” trajectory? Does growth moderate from here - like a “square root” sign? Or does the recovery begin to look more like a “K”?
With Lack of the Next Fiscal Stimulus Package a K is More of a Possibility
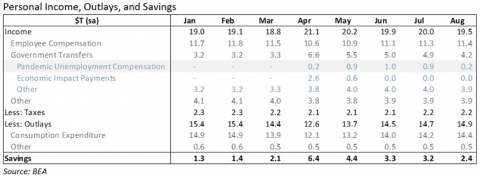
On the one hand, “K” seems like a possibility, especially with fiscal stimulus talks stalling. Jobs where individuals can work from home are adapting to the new environment, and business activity continues to improve. They would make up the upper arm of the K. The sectors that have suffered the most from COVID shutdowns – restaurants, amusement parks, movie theaters, travel etc. - have only gradually begun to improve. Fiscal stimulus money that was intended to help those industries and workers most vulnerable is running out. See Table 1. If we do not pass another fiscal stimulus plan, spending from this cohort of the population could trail off. This would become the lower leg of the K. Jerome Powell, Chairman of the Federal Reserve, recently commented “The risk is that over time [the unemployed] go through those savings…. Their spending will decline, their ability to stay in their homes will decline, so the economy will begin to feel those negative effects… I think that it is likely that more fiscal support will be needed.” The amount of fiscal stimulus possible after the upcoming Presidential election will depend on the outcome, with most analysts suggesting that a Democratic sweep would provide the most fiscal stimulus.
Table 1
Pandemic Fiscal Stimulus is Waning
A Vaccine will Help us Avoid a ‘K”
A vaccine will help us avoid a “K” by allowing people to feel more comfortable going back to work and consuming services. We believe that one of the most important areas for the stock market and the global economy, is that we must have at least 2 vaccines that are 75%-90% effective by the end of the first quarter of 2021. Currently 38 states in the US are seeing rising numbers of COVID cases. Europe COVID cases are skyrocketing. Fiscal stimulus and intelligent return to work programs can only provide a bridge until the vaccines arrive. Once they do, we expect that there will be a global worldwide cyclical upturn which could push equity markets up thru next year. We are believers in the science, and we are quite confident that this will come to fruition over the next year.
Strong Housing, Low Inventories, and a High Savings Rate Could Provide Support for Continuation of a “V”
On the other hand, continued growth going forward (perhaps at a slower rate) remains a strong possibility for three primary reasons: Housing is strong, inventories are low, and the savings rate is high. Housing strength ultimately leads to stronger economic growth overall as homeowners spend more than renters. Low inventories are a precursor to rebuilding inventories, which also supports economic growth. Finally, when savings rates are high there is extra capacity for consumers to spend.
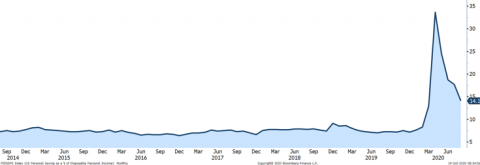
Graph 3
Homebuilders Are Seeing the Strongest Demand Since 2004
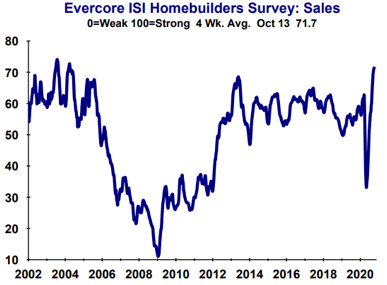
Source: EvercoreISI
Graph 4
Companies Say That Their Inventories Are the Lowest Since At Least 2014
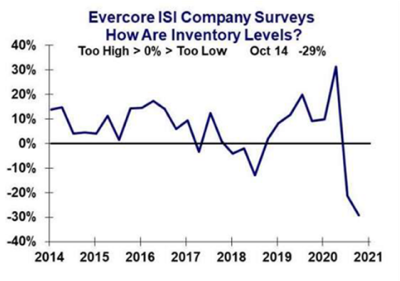
Source: EvercoreISI
Graph 5
Consumer Savings Rate (Currently 14%) Is Double Recent History
Source: BEA
If China Is Showing Us the Way, then Perhaps the Recovery Path from Here Looks Like a V Followed by a Slowing Growth Rate, Similar To a “Square Root”.
China is a few months ahead of us in their recovery, and thus could shed some light on how the future recovery may look in the US. China’s ability to slow the spread of COVID, and subsequently support economic growth has been impressive. According to EvercoreISI, year-over-year GDP growth in China could be as strong as 5% in Q3 and 6% in Q4. Even if the US is unable to replicate such strong domestic economic improvement, it should benefit from growing China demand.
Graph 6
China Looks Like a V Followed by a Slowing Growth Rate: Square Root?
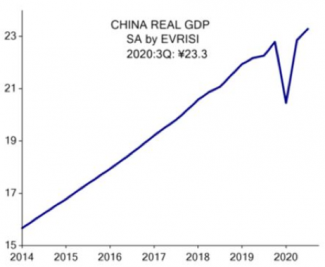
Source: EvercoreISI
We Made Several Major Adjustments to Your Portfolios This Quarter:
Trimmed Tech
Added to Other Cyclicals
Initiated with Clean Energy
Trimmed Gold (We still like the inflation hedge)
Swapped our MedTech Holding
We made several adjustments to your portfolios this quarter. The most notable was the beginning of a transition out of technology into other cyclicals. While we have reduced our cash position slightly over the past quarter, we are still keeping cash levels higher than normal in the near-term, as we work through election uncertainty and concerns of rising COVID cases heading into Fall/Winter.
The stock market, like the economy, has seen its share of “V” and “Swoosh” participants. For example, the S&P 500 index was up about 6% YTD through September 30. The NASDAQ index, which is technology heavy was up 25% (“V”). Meanwhile the S&P 500 industrials index was down 4% YTD (“Swoosh”).
We believe that as we get closer to a vaccine, mitigation efforts improve, and treatment options become more available, that stock market beneficiaries will broaden out from technology winners to other cyclical winners. Thus, this quarter we trimmed several tech stocks and purchased other cyclicals.
We took initial investments in two clean energy stocks. From a socio-economic perspective, we believe that the trends supporting clean energy are here to stay as demand from corporations, governments, and consumers is increases and the cost of the technologies decline. In addition, Biden’s proposed infrastructure plan includes a significant focus on clean energy. If he wins the election and there is a Democratic sweep, we anticipate even more investment in this area.
We sold an investment that we have held for at least 10 years. We liked the company for its diversification, inflation hedge, and income. During the depths of COVID, the company suspended its dividend. Because income was a large portion of our investment thesis, their action during COVID was concerning to us. Thus, when the stock price recovered to pre-COVID levels, we decided to sell.
We trimmed gold. Last quarter gold was the largest holding in your portfolios, at over 5%. Gold rose significantly in early August, and we took the opportunity to trim allocations to 3.5%.
Many Secular Trends Remain in Place
We swapped our medtech holdings. Our original medtech holding was a great investment for us. However, the company had some manufacturing issues, and we felt that their COVID new product response was underwhelming. Thus, our risk/reward outlook was less favorable, and we sold. We subsequently purchased another medtech company. Over the past several years, their relative growth rate vs. peers has been low, and they were losing market share. However, in 2019 they brought in a new CEO to accelerate change, and they are now on the cusp of one of the largest new product launch schedules in their history. They have 4-5 new products that could each be multi-billion-dollar businesses. One of the highlights is their upcoming robotic surgery launch in 2021. Unlike many of its peers, valuation multiples are not stretched, the balance sheet is strong, and they pay a 2% dividend.
Many secular trends remain in place and have even accelerated with COVID. We have highlighted some of the trends below.
- 5G
- Cloud
- Gaming
- Streaming
- Electronic Payments
- AI
- Electric Cars
- Robotics
- Infrastructure Spending/Onshoring
- COVID Testing/Treatment
- Online Retail
- Cannabis
Low Interest Rates Make Dividends More Valuable
The dividend yield on our model equity portfolio is currently around 2.1%. This compares with the S&P 500 dividend yield of 1.8%, and the US Treasury 10-year yield of 0.7%. Given our focus on conservative portfolios, we tend to invest in large cap companies with strong balance sheets. Many of these companies pay a dividend. With interest rates very low, the value of this income only increases. Approximately 30% of the companies in your portfolios have dividends greater than 2.5%. Going forward, with interest rates so low, we will put more weight on dividend yield when considering adding companies to our portfolios.
We Added Clean Energy to Our Mutual Fund Portfolios
Our conviction on clean energy is high and we added it to our multi-asset class mutual fund portfolios. We purchased a clean energy ETF – to represent 3.5% of the equity allocation. In emerging markets and international funds, we changed our strategy early this year to be 50% index and 50% actively managed funds. Our actively managed funds outperformed.
Yield Is a Scarce Commodity
Yield is so very hard to find. Currently the yield on 5-year investment grade corporate bonds is under 1%. We purchased fixed income for safety as well as income. Thus, despite the low yields we do not want to add more risk. We are keeping our duration short and credit quality at investment grade. However, in the equity side of allocations, we are working on increasing the dividend yield of the portfolios. For those with the appropriate risk allocation we are looking at alternative investments that provide income.
We look forward to speaking with you soon and thank you for entrusting us with the management of your money.
|
Sincerely, |
|
 |
 |
|
John A. Zaro III, CFA®, CIC |
Laura K. Drynan, CFA®,CFP®,CIC |
This letter should not be relied upon as investment advice. Any mention of particular stocks or companies does not constitute and should not be considered an investment recommendation by Bourgeon Capital Management, LLC. Any forward-looking statement is inherently uncertain. Due to changing market conditions and other factors, the content in this letter may no longer reflect our current opinions. Different types of investments involve varying degrees of risk, and there can be no assurance that the future performance of any specific investment, investment strategy, or product made reference to directly or indirectly in this letter will be profitable or suitable for your individual portfolio. In addition, past performance is no indication of future results. Please contact us if you have any questions regarding the applicability of any matter discussed in this letter to your individual situation. Please contact us if your financial situation or investment objectives change or if you wish to impose new restrictions or modify existing restrictions on your accounts. Our current firm brochure and brochure supplement is available on the website maintained by the Securities and Exchange Commission or from us upon request. You should be receiving, at least quarterly, statements from your account custodian or custodians showing transactions in your accounts. We urge you to compare your custodial statements with any reports that you receive from us.
Bourgeon Capital's Market InsightsSummer 2020 Spring 2020 Winter 2019 Fall 2019 |