Bourgeon Capital's Market Insights: Summer 2019
“Putting all of our Eggs in the Central Bank Basket”
This is the longest US economic expansion in history, with over 120 months of economic growth. The S&P 500 was up over 17% year-to-date through June, the best first-half gain since 1997, and more than twice the average annual rate. Yet there are growing risks as the yield curve has been inverted for two months, global economic growth is weakening, corporate profits are declining, trade wars continue, and geopolitical tensions are increasing. It appears that investors are pinning all their hopes on central banks around the world, expecting them to come to the rescue once again by reducing interest rates. Investors are putting all their eggs in one central bank basket. But will this be the case? What happens if the Fed doesn’t reduce rates by 75 basis points this year, following the script that investors have already written? What happens if Japan and Europe don’t follow suit or underwhelm? We have a dual mandate to both grow and protect assets, and we see the forward risk/reward less appealing given the growing risks. So we ask ourselves: “After such a great first half run and with the negatives gaining steam, why continue to play?” Our cash holdings now represent about 20%.
When the Yield Curve Inverts, a Recession Typically Follows… …and the Stock Markets Historically Peak 8-13 Months Ahead of a Recession.
The yield curve has been inverted for two months. We look at the spread between the 3-month T-Bill and the 10 year Treasury. Historically when the spread is inverted (i.e. one gets a better return investing in a 3-month T-bill than in a 10-year Treasury), a recession has followed in 7-24 months. See Graph 1 on the following page. The bond market is indicating concern about future growth and is telling the Federal Reserve that they should be cutting rates. In fact, the bond market thinks that the Fed should cut rates by 75 basis points this year. It is a global phenomenon, with investors expecting rate cuts in Europe and Japan.
In addition to the bond market, CFOs are concerned about the economy. In the most recent Duke CFO Global Business Outlook, “nearly half of Chief Financial Officers in the United States believe the nation’s economy will enter a recession in about a year.
Wall Street often moves before Main Street, with the stock market historically peaking 8-13 months ahead of a recession. According to Rich Ross, technical strategist at Evercore ISI “The previous two instances of yield curve inversion were coincident with the prior two easing cycles and came within months of major market tops.” We call this a “Market Mismatch,” and is the reason why we are underweight risk assets.
Graph 1
Market Mismatch
Yield inversion signals recession risk while stocks hover near record highs
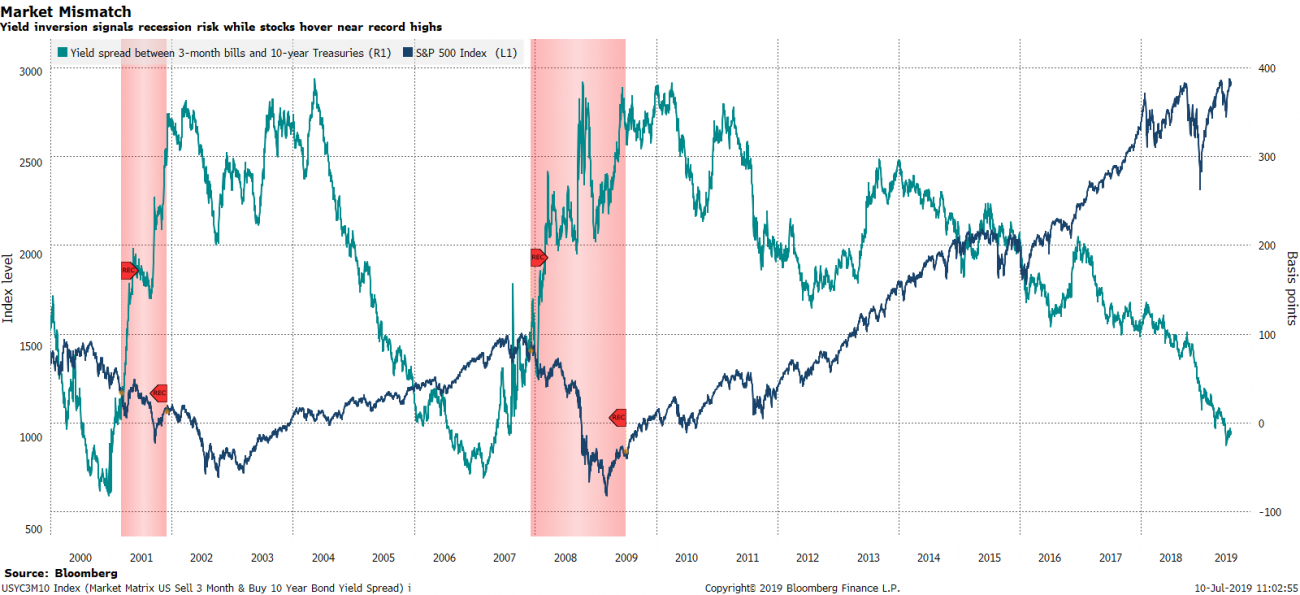
Source: Bloomberg
Let’s Assume that the Fed Reduces Rates. What Happens Into the First Cut?
The expectation of universal easing boosted government bond markets this year. But do equity markets do well when central banks cut rates? It all depends on why central banks are cutting rates. Looking back at history, when the Fed has cut rates into a weakening growth environment (2000 and 2007) then the equity market performed poorly. However, when the Fed has cut rates to provide ‘insurance’ (1995 and 1998), rather than due to a particularly pessimistic baseline outlook for the economy, then the equity markets performed strongly.
Which is it this time?
It is our belief that the Fed is cutting rates into a weakening US and global growth environment. One indicator that we rely on to give us a view into the future is the purchasing manager’s index, which shows the prevailing direction of economic trends in the manufacturing and service sectors. A level over 50% implies economic expansion, while a level under 50% implies economic contraction. Evercore ISI has compiled a manufacturing purchasing manager’s index with equal weights for China, Eurozone, and the US. For June the level on the composite was 49.2%. See Table 1. For the US alone the level of the HIS Market US Manufacturing PMI was just over 50, and is the second-lowest figure since September 2009.
Table 1
Global Growth is Weakening
Manufacturing PMIs with Equal Weights For China, Eurozone, and US
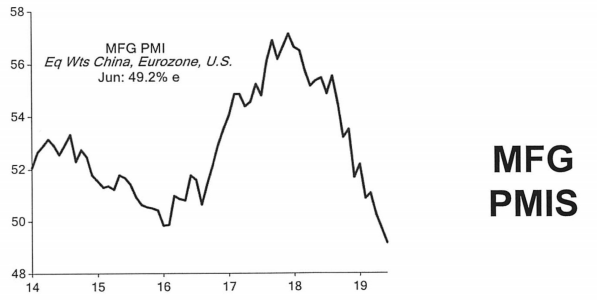
Source: Evercore ISI
We are Concerned That Q2 Earnings Could Show More Weakness Then Anticipated
PMIs are a forward-looking indicator and imply to us that there is future earnings risk. After getting a boost from tax cuts in 2018, earnings estimates for the S&P 500 are starting to decline. In 2018 S&P 500 earnings were up 28%. This contrasts sharply with year-to-date earnings which are currently estimated to contract 8%. We believe that Q2 earnings might have more negative surprises than investors expect.
Is Central Bank Easing Really the Only Basket? What About Trade Resolution and Fiscal Stimulus?
It is our opinion that tariff and trade concerns with China (and with other countries) are primary contributors to the current global economic weakness. If one doesn’t know what the sandbox rules are, then it’s hard to play. It becomes more difficult for companies to deploy capital and economic growth subsequently slows. Therefore, if trade tensions decline, this would absolutely help global growth over time. However, we believe that we are unlikely to get a resolution in trade with China until at least the beginning of 2020. The US appears resolute in its demands, and so does China. At this point, neither economy has sufficient distress for either side to give in to the demands of the other. And we believe that we are not yet close enough to the Presidential election for capitulation.
If our economy weakens, then in addition to monetary stimulus one would normally also look toward fiscal stimulus. Our expectations for fiscal stimulus are relatively low given that our government debt levels are abnormally high after the tax cuts of 2018. However, there are several Democratic candidates who are espousing Modern Monetary Theory. They might be willing to significantly increase already high domestic debt levels to pay for increased government spending in order to stimulate the economy.
We have been Transitioning to a More Defensive Position Since the Middle of 2018.
We remain underweight risk assets. At the end of the second quarter 2019, we are holding about 20% cash in our all equity accounts. Our target 60% equity portfolios are holding 12% cash. We have invested most our cash in short-term Treasuries yielding 2.0-2.5%, or high yielding money market funds.
We focused our sales to reduce our cyclical exposure and/or where we believed valuations were stretched. We sold two industrials after strong year-to-date runs to reduce cyclicality as we see global growth slowing. We trimmed several companies on strength.While we did add to cash, we also added to some positions where we felt the risk/reward was more favorable.
We added to our position in an oil refinery company. We see a near-term catalyst with IMO 2020 – regulation that will require ships to burn more environmentally friendly fuel. This company is trading at under 1x book value, compared to a historical average of 2x book.
We added to a potential beneficiary of 5G technology. 5G represents a major technology shift in mobile connectivity that will revolutionize the technology sector. Not only will it bring faster downloading speeds, greater network capacity, and low latency for mobile devices, it has the ability to transform and advance the IoT (Internet of Things), autonomous vehicles, and even remote surgery among many other modern advancements. It will help us communicate and use technology more efficiently while facilitating a new wave of innovation. This company should be a significant beneficiary of this trend. Valuation is not demanding, with a PEG (PE-to-Growth) ratio of close to 1x and a dividend yield of 3%. With modest valuation and a 5G catalyst, we believe that this company should be a solid performer going forward.
Mutual Fund Portfolios: Increased Cash Positions
During the second quarter, we raised cash for our all-equity mutual portfolios to match the high levels of cash in our traditional investment management portfolios. All other holdings remained the same.
The 10-Year Yield Dropped 120bps in Seven Months. Wow that Was Fast.
In November 2018 the 10-year yield peaked at just over 3.2%. Only seven months later the 10-year yield is at 2.0%, a decline of 120 bps. Investors are asking the Federal Reserve to cut rates, and Chairman Powell has said he “will act as appropriate to sustain the expansion.” Corporate spreads have moderated a bit since last quarter and are currently about 140bps, about average with history. We will monitor the yield curve to be opportunistic. For our municipal portfolios, the muni market yield curve has not inverted (although the curve is very flat in the short end).
Over the past several years we have increased the financial planning capabilities at Bourgeon. We currently utilize goal-based financial planning discussions and software as well as personal financial websites to assist our clients in navigating their unique financial journey. If you haven’t already taken us up on the offer of these services, please do so. We find them to be incredibly helpful, insightful, and fun. “Those who plan often fare better than those who don’t.”
As always, we welcome the opportunity to discuss your portfolio and our current thinking with you at any time. While we have only spoken generically about asset allocation in this letter, we believe that it is a very individual decision. We do our best work for you when we are up-to-date on changes that may be occurring in your lives. We enjoy speaking with you and sharing ideas on a consistent basis; if your situation changes at any time between our regular discussions, please reach out to us and let us know.
We look forward to speaking with you soon and thank you for entrusting us with the management of your money.
Sincerely,
|
John A. Zaro III CFA®, CIC |
Laura K. Drynan CFA®,CFP®,CIC |
Important Disclosure:
This letter should not be relied upon as investment advice. Any mention of particular stocks or companies does not constitute and should not be considered an investment recommendation by Bourgeon Capital Management, LLC. Any forward-looking statement is inherently uncertain. Due to changing market conditions and other factors, the content in this letter may no longer reflect our current opinions. Different types of investments involve varying degrees of risk, and there can be no assurance that the future performance of any specific investment, investment strategy, or product made reference to directly or indirectly in this letter will be profitable or suitable for your individual portfolio. In addition, past performance is no indication of future results. Please contact us if you have any questions regarding the applicability of any matter discussed in this letter to your individual situation. Please contact us if your financial situation or investment objectives change or if you wish to impose new restrictions or modify existing restrictions on your accounts. Our current firm brochure and brochure supplement is available on the website maintained by the Securities and Exchange Commission or from us upon request. You should be receiving, at least quarterly, statements from your account custodian or custodians showing transactions in your accounts. We urge you to compare your custodial statements with any reports that you receive from us.
Bourgeon Capital's Market InsightsSpring 2019 Winter 2018 Fall 2018 Summer 2018 |
For more information, please contact us:
777 Post Road
Darien, CT 06820
203.280.1170 | info@bourgeoncapital.com