Bourgeon Capital's Market Insights: Spring 2018“Main Street May Be Better Than Wall Street”Ray Dalio, founder of Bridgewater Associates, one of the world’s largest hedge funds |
|
We struggled with the quote this quarter. We initially wanted to give a tribute to Stephen Hawking and use his quote “However difficult life may seem, there is always something you can do and succeed at. It matters that you don’t just give up.” It was a great quote to send to our kids, but we couldn’t seem to tie that into our investment viewpoint. The next quote we considered was from Warren Buffett in 2014. “The line separating investment and speculation, which is never bright and clear, becomes blurred still further when most market participants have recently enjoyed triumphs. Nothing sedates rationality like large doses of effortless money.” We liked this quote because it helps describe our recent investor discussions surrounding many high flying investments (some that we are invested in and some not) and cryptocurrencies. In the end it didn’t capture the current confusing cross currents we see. Thus, we chose a February 2018 quote from Ray Dalio that we believe simply and easily tells the story: “Main Street May Be Better Than Wall Street.” During the first quarter of 2018 we continued our strategy of selling some of our technology stocks on the upswing while rotating into those stocks we believe will benefit from higher economic growth, inflation, and interest rates. |
Main Street is Strong as the Overall Economy Shows StrengthEconomic growth is strong in the U.S. and around the world. The outlook for 2018 and 2019 global GDP was revised upward to 3.9% recently by the International Monetary Fund. The improvement was supported by strength in Europe and Asia as well as a boost from tax cuts in the United States. In addition, the Conference Board Index of Leading Economic Indicators has been positive since the middle of 2016. This Index is a good barometer of growth 6 months ahead.
Table 1 The US Economy Has Positive Momentum Conference Board Index of Leading Economic Indicators 2013-2018 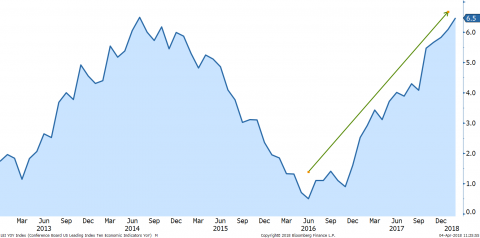 Source: Bloomberg, Conference Board But Volatile Stock Markets Mean Wall Street is Asking: “What Comes Next?"If Main Street is so strong, why isn’t Wall Street celebrating? It’s all about future expectations. Wall Street is asking itself “Now that we have had great growth-accelerating events including tax cuts, what comes next? Buybacks? Infrastructure Spending? More tariffs? Higher inflation? Higher interest rates? Political uncertainty?” Except for buybacks, these all add up to an increased potential for growth to slow at some point. The volatility is a result of the push/pull of market expectations. Stock Buybacks Still to HelpWhile most companies have attempted to quantify the benefit from the Tax Cut and Jobs Act of 2017, one area that could still surprise positively is the potential for stock buybacks, debt reduction, or capex to come from forced repatriation. According to JPMorgan repatriation has the potential to be at least $800 billion in share repurchase. Goldman Sachs believes share repurchases could be as much as $1 trillion. Cisco is one company that has reported an increase to its stock buyback program from $6 billion to $31 billion. CSCO has said that this will occur over the upcoming 18-24 months, and it currently represents approximately 15% of the company’s market capitalization. This repurchase ability provides good downside support. Apple has not yet announced any additional share repurchase. Based on some back of the envelope calculations, AAPL might have up to $125 billion available for share repurchase. Don’t Hold Your Breath For Government Led Infrastructure SpendingLooking forward, beyond tax cuts, we do not see much additional fiscal stimulus coming from infrastructure spending. We did not get healthcare reform from this administration in 2017. Therefore, there is no ‘cost savings’ that can be applied to offset any additional fiscal stimulus. Our discussion with several industrial analysts and government watchers leads us to believe that government-led infrastructure spending programs are probably a no go. Tariffs Are Generally NegativeWhile we do not know if ultimately the recent tit for tat Trump Tariffs with China will have more bark than bite (as we have already seen with steel tariffs), a more protectionist stance by the US is generally seen as a negative. Open economies tend to have more efficient use of resources. Closed economies lead to inefficiencies, and often more inflation. Hopefully China and the US can negotiate a better outcome than a full blown trade war. Inflation is Starting to IncreaseInflation is lurking. Low unemployment is a very common leading indicator for inflation. When employers find it difficult to hire workers, they will then pay them more. Employees with more money in their pockets tend to buy more. More demand for goods and services leads to higher prices in general. Currently unemployment in the US is around 4% compared with an average of 5.7% since 1950. Wages are growing about 3%+, which is twice the growth rate of a few years ago, and now the average of the past 20 years. Higher Interest Rates are the Solution for InflationToo much inflation is considered a bad thing. So, Central Banks around the world seek to create a balance between growth and inflation. When inflation becomes a concern, they will raise rates in order to slow the economy. This is where we are today. The Fed has raised rates to 1.75% from zero during the past 2.5 years. When Do Higher Interest Rates Begin to Hurt the Economy?When do higher interest rates begin to hurt the economy? We’ve been debating this question for several months. Some very smart people think pain will be felt when the 10-year US Treasury yield reaches 3% – and we are there already. In many ways the economic benefits of recent tax cuts may help to offset some of the pain of higher rates. But there is no doubt that higher interest rates are beginning to affect consumer behavior. We can see this in higher delinquency rates on credit cards. Or perhaps you have a home equity line of credit, and you have seen this increase from 3% or so a few years ago, to over 5% today. What about student loans? We Are Respectfully Watching Signs of Credit StressWe are beginning to see signs of stress in the credit markets. One such area is in the LIBOR-OIS spread. Back in 2009 Greenspan said “Libor-OIS remains a barometer of fears of bank insolvency.” It is only one of the many indicators that we use to monitor the credit markets. While many smart analysts are telling us not to be concerned this time around, however, we are taking it as a sign to respectfully watch the levels. Table 2 The Credit Markets Are Showing Signs of Stress LIBOR-OIS Credit Spreads since 2010 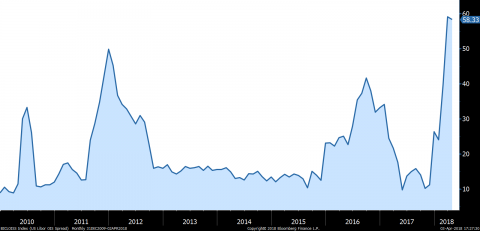 Source: Bloomberg Bonds are Now Higher Yielding Than Stocks, Reversing a 10-year TrendAnother area where we are seeing the negative effects of higher rates is in the relationship between stocks and bonds. For the past decade the dividend yield on stocks was higher than the yield one would receive on a 2-year Treasury bond. This was an unusual phenomenon that pushed typically risk-averse investors to buy stocks over bonds. But this relationship has now reversed. The yield on the 2-year Treasury is now above the dividend yield on the S&P 500. This is the first time in 10 years that this has happened, and may sway investor decisions. Table 3 The Yield on the 2-Year Treasury is now Above the S&P 500 Dividend Yield 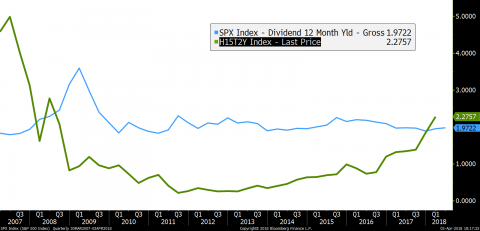
Source: Bloomberg Main Street May be Better than Wall StreetAs the stock market adjusts to these new risks – inflation, interest rates, and tariffs – there could be increased volatility. Thus, it is possible that Main Street could perform better than Wall Street this year. Valuation Does Matter! (In Our Humble Opinion)Just as there was the Nifty 50 during the 1950s, we now have the FAANNG stocks (Facebook, Apple, Amazon, Netflix, Nvidia, and Google). These are the current “must own” stocks. Here are some interesting statistics:
When clients say to us “valuation doesn’t matter”, or when analysts have to create new valuation metrics to support ever higher price targets, we get nervous. We always ask ourselves, “What happens if everyone is wrong? What is the downside risk?” The farther you climb on the upside, the more it hurts when you fall. We’ve seen this story before. We Continued to Sell on Strength in Q1 2018 –Trimming Technology to Buy Banks, Industrials, and CommoditiesA view toward downside risk becomes even more important since we are in the midst of quantitative tightening (i.e., rising interest rates and the reduction of the Federal Reserve’s balance sheet). In general we believe that just as quantitative easing led to higher multiples, quantitative tightening should lead to lower multiples. Those stocks with the highest multiples therefore carry some of the highest risks. During the first quarter of 2018 we once again reduced our equity exposure by about 200 basis points. We are underweight “target equity allocation exposure” by approximately 10-15%. We Shortened our Bond Ladder Even FurtherAs the Federal Reserve has increased short-term interest rates, this has not been followed by an increase in long-term interest rates. Thus the yield curve has flattened. This means that one is getting paid almost the same for a 2-year bond versus a 5-year bond. The incentive is no longer there to add duration, and thus we have shortened our bond maturities even further. We also sold most of our high-yield bond funds over the past 6-9 months as we did not believe that investors were getting paid enough for the risk.
As always, we welcome the opportunity to discuss your portfolio and our current thinking with you at any time. While we have only spoken generically about asset allocation in this letter, we believe that it is a very individual decision. We do our best work for you when we are up-to-date on changes that may be occurring in your lives. We enjoy speaking with you and sharing ideas on a consistent basis, and if your situation changes at any time between our regular discussions, please reach out to us and let us know. We look forward to speaking with you soon and thank you for entrusting us with the management of your money. Sincerely,
Important Disclosure:This letter should not be relied upon as investment advice. Any mention of particular stocks or companies does not constitute and should not be considered an investment recommendation by Bourgeon Capital Management, LLC. Any forward-looking statement is inherently uncertain. Due to changing market conditions and other factors, the content in this letter may no longer reflect our current opinions. Different types of investments involve varying degrees of risk, and there can be no assurance that the future performance of any specific investment, investment strategy, or product made reference to directly or indirectly in this letter will be profitable or suitable for your individual portfolio. In addition, past performance is no indication of future results. Please contact us if you have any questions regarding the applicability of any matter discussed in this letter to your individual situation. Please contact us if your financial situation or investment objectives change or if you wish to impose new restrictions or modify existing restrictions on your accounts. Our current firm brochure and brochure supplement is available on the website maintained by the Securities and Exchange Commission or from us upon request. You should be receiving, at least quarterly, statements from your account custodian or custodians showing transactions in your accounts. We urge you to compare your custodial statements with any reports that you receive from us Bourgeon Capital's Market InsightsWinter 2017 Fall 2017 Summer 2017 Spring 2017 |
For more information, please contact us:
777 Post Road
Darien, CT 06820
203.280.1170 | info@bourgeoncapital.com